
Teaching Semantic Web in public
A 12-week curriculum turning RDF, OWL, SPARQL, and modern knowledge graphs into practical, project-based learning—with readable explanations and honest tradeoffs.
Explore the curriculum ↗ See Module 1 →
Currently on Module 1 of 4:
HOW I WORK
Find the shared model
Before a team can automate a workflow, people need a common picture of the problem. I surface the language, assumptions, decisions, and constraints the architecture has to support.
Interactive
Try my Digital Twin
Ask an AI grounded in my projects, writing, and frameworks. Use it to explore my work, unpack a difficult idea, or see how I reason through an ambiguous problem.
Featured Projects
Self-hosted data products, AI systems, and knowledge graphs—built end-to-end to learn what actually works in production.
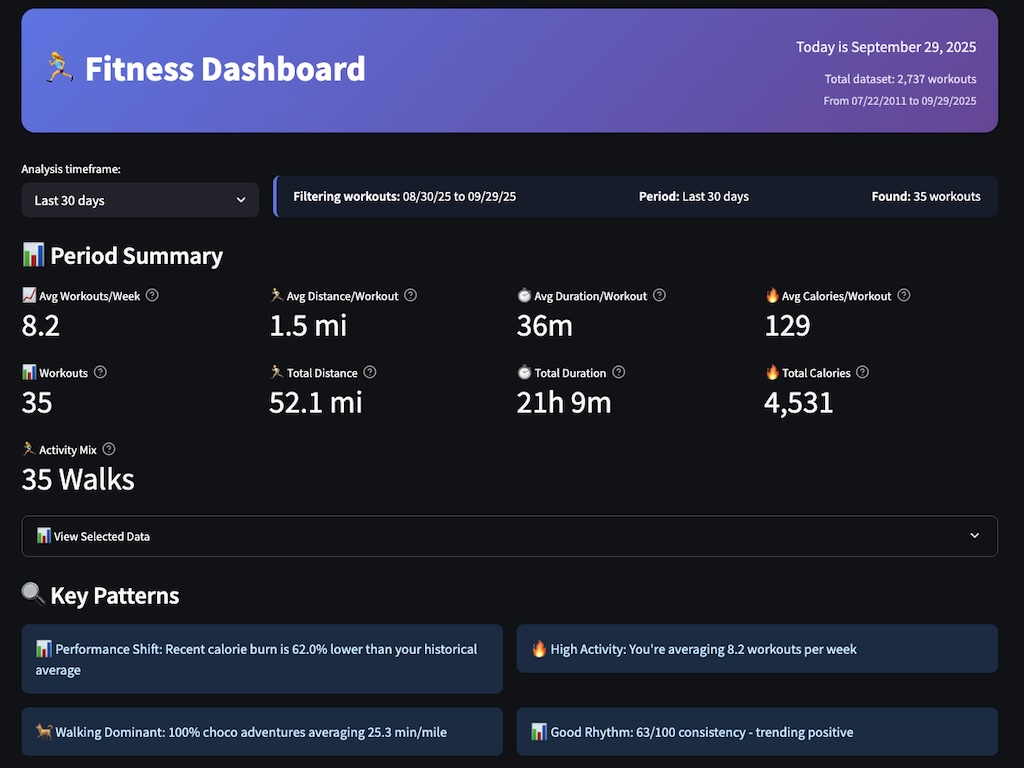
Self-Hosted Workout Intelligence
14 years of workouts. One classifier. Every conclusion shows its work.
When my running history collided with daily dog walks, everything got logged as a “run” — including the 30-minute sniff safaris. So I built the full pipeline (CSV export → Lambda → MySQL → Streamlit) with an ML classifier that tells real runs from walks.
The part I’d defend in a design review: every insight is one click away from exactly how it was calculated — confidence scores included.
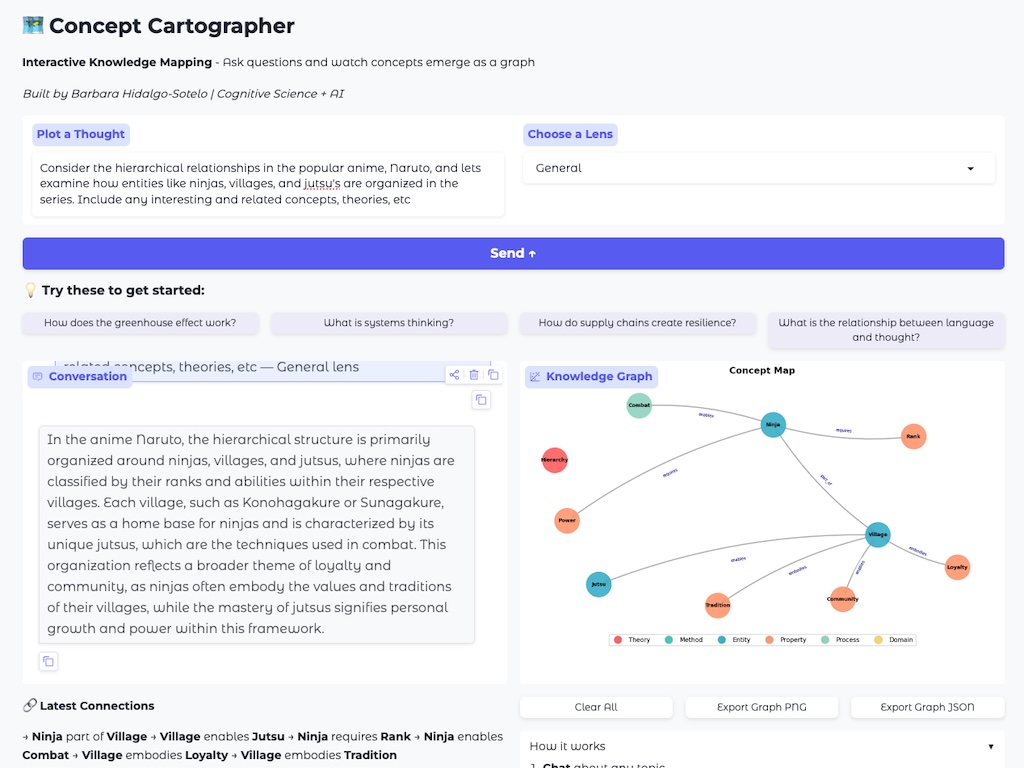
Concept Cartographer
Chat and watch the conversation become a structured graph.
Every turn, a single structured LLM call returns both the conversational answer and the extracted concepts and relationships, growing a map across the conversation. Over 30 nodes, new concepts must connect to an existing node — so it stays a map, not a junk drawer. Export a PNG image or copy the JSON into a graphDB.
The part I’d defend in a design review: one call extracts narrative and ontology simultaneously — about half the latency and cost of the obvious two-call approach.
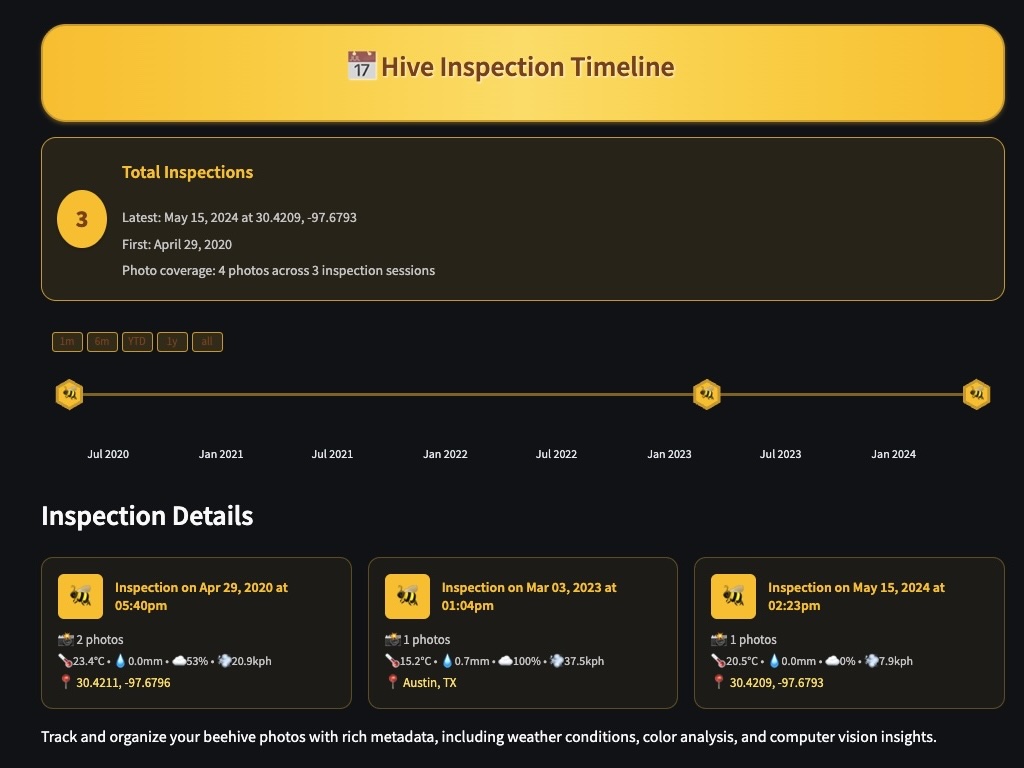
Beehive Analytics Platform
Four years of hive photos, turned into a record I can actually query.
The bees don’t keep records. So EXIF metadata, Google Cloud Vision, and weather APIs turn my inspection photos into a knowledge graph with a query UI — when swarms happened, which seasons produced, what weather preceded trouble.
The part I’d defend in a design review: a real multimodal pipeline — image metadata, vision API, color analysis, weather correlation — serving a craft I practice every week.
Featured Writing
A mix of notes & experiments, data narratives, and essays & perspectives—built to show how I approach messy problems.
Data Narrative
The Beekeeper’s Time Machine
Explore how extracting timestamps and visual features from years of my own hive photos lets me travel through inspection history, revealing rhythms, surprises, and insights that would otherwise remain hidden.
Read the story →Tutorials & Guides
Building a Sustainable Digital Home
A supportive, skills-forward series that helps you launch a personal website, automate publishing, document your process, and build a platform you’ll actually want to keep using over time.
Open the guide →Applied Thinking
Making Mermaid Diagrams Work for You
Cut through the chaos of tangled graph drawings with practical tips and structured approaches that bring confidence to crafting Mermaid diagrams that actually convey what you mean.
Read the post →Cognitive Principles in Practice
Metadata Matters
Just as our brains rely on associations to retrieve memories, the web relies on metadata to surface meaning from the void.
More on metadata, the digital equivalent of cognitive context →Cognitive Offloading
Leverage preattentive attributes—like position and luminance—to design dashboards that respect the brain's processing limits.
Designing for How People Actually See →Grow from Messiness
Life rarely fits into neat database schemas. I used ML on my real-world exercise data, granting me trust in my own metrics again.
Why perfect data is not a prereq for a healthy system →At-a-Glance: Education & Big Moves
Quick visual timeline of the milestones that shaped my path — from UT Austin and MIT to data science and consulting.
Made it this far? If anything resonated — a project, a principle, a half-finished thought — I'd love to hear from you.